The problem
Static qPCR plots make it hard to connect a change in starting copies, efficiency, or reaction conditions with the resulting curve. Learners need to change an input and inspect its effect.
Science systems / active
Interactive qPCR simulator for testing how assay inputs change amplification curves.
Static qPCR plots make it hard to connect a change in starting copies, efficiency, or reaction conditions with the resulting curve. Learners need to change an input and inspect its effect.
qPCR teaching model, browser controls, and amplification-curve visualization.
A runnable teaching tool for exploring how assay inputs change simulated amplification curves and Ct values.
Statusactive
Evidencerunnable
Record reviewed
Implementation
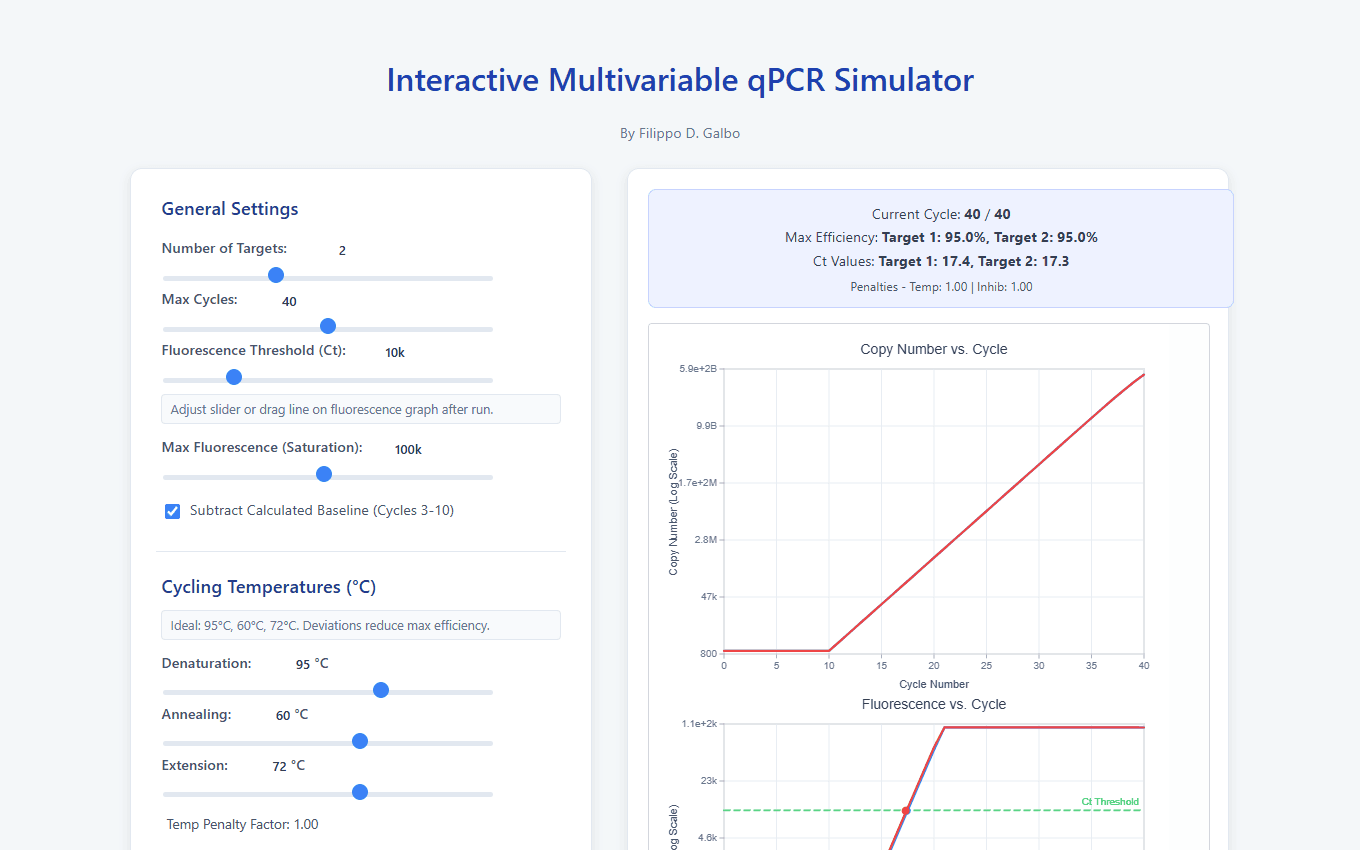
Set target copies, efficiency, cycling temperatures, inhibitors, and other inputs, then run the browser simulation. It plots amplification and fluorescence across cycles. After a run, moving the fluorescence threshold recalculates Ct values.
The runnable artifact includes controls for multiple targets, reaction conditions, threshold, and baseline subtraction. Its plots are model output rather than measurements from an instrument.